[Unit 2] Pre-Class Activities
[Unit 2] Pre-Class ActivitiesPC March 16 - Introduction to R (07-01)AssignmentAdvanced user?SubmitPC March 18 - Introduction to dplyr (07-02)AssignmentAdvanced user? SubmitPC March 23 - Introduction to {ggplot2}AssignmentAdvanced user? SubmitPC March 30 - ggplot2 - the return!AssignmentAdvanced user? SubmitPC April 01 - Definitions of inequality ReadCompletePC April 06 - Trends in inequality Read Optional PC April 08 - Neighborhoods and income mobilityReadOptionalInstructionsPromptsPC April 13 - Impact of Policy on InequalityReadOptionalInstructionsPrompts[Unit 3] Pre-Class ActivitiesPC April 27 - Returns to EducationReadInstructionsPrompts
PC March 16 - Introduction to R (07-01)
The purpose of this pre-class activitiy is to get you set up for us to introduce R in class. See below if you're an advanced user.
Assignment
Install R
You can download R from CRAN. Select your operating system.
Windows users: Select
base, and then download and install RMac users: Download and install R-4.04.pkg
If you get an error message, then you should hold down the
controlkey while clicking the package, then select "open" (still holding the key), and once you see a warning message, select "open."Install R Studio. You can either get the standard version (RStudio Desktop) here, or you can grab a "preview" version, which has fun new updates. I recommend preview version, but it's your call.
Complete Programming Basics tutorial (Note: you will need to create a free RStudio Cloud account). In terms of time budgeting, note that this will involve you watching 7 videos that are 1-2 minutes long. There will also be short activities you can do, in which you type into boxes and click "run code" to test it. You should do these too!
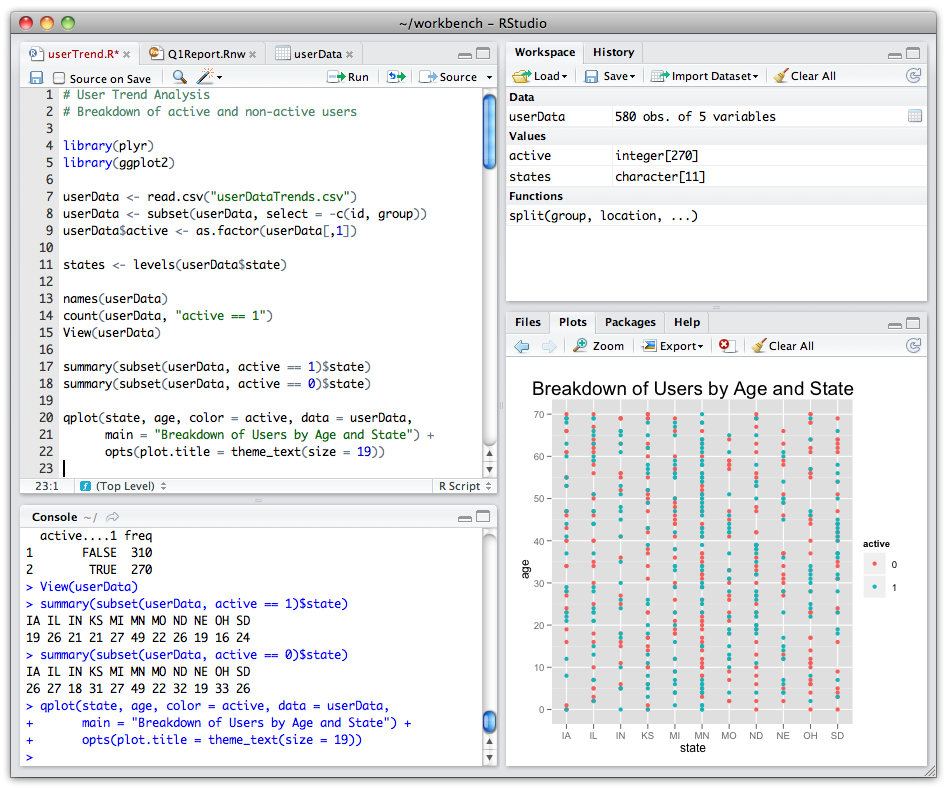
Open RStudio on your computer. You know things are good if you see something that looks like a emptier, sadder version of this.
Type the following code in your Console window and press Enter:
sqrt(pi). Look, you calculated !Install the tidyverse! Type the following code in your Console window and press Enter:
install.packages("tidyverse")It incldues fun friends like
dplyr(pronounced "dee-plier") and more!Tell R to use
dplyr. Type the following code in your Console window and press Enter:xxxxxxxxxxlibrary(dplyr)Make sure your computer can do all the things: Type or copy-paste the following code in your Console window and press Enter:
xxxxxxxxxxstarwars %>% filter(species == "Droid")What is IG-88's height, mass, and homeworld?

Advanced user?
Most of this will not be necessary. You should still answer the prompts, which will require you to do parts (7) and (8) of the assignment.
The R Introduction page contains instructions on installing R and R Studio, plus some general background.
Submit
Submit on Blackboard the answers to the following questions (in our pre-class assignments)
- Tell me a bit about your comfort level and experience with R. What would be useful for me to know?
- If you haven't used R before, what challenges did you encounter going through the following steps? What questions do you have?
- What is IG-88's height, mass, and homeworld?
PC March 18 - Introduction to dplyr (07-02)
Assignment
Complete the following 3 primers:
You'll notice that you can work through examples in the tutorial, run your code, and compare against the solutions. I strongly recommend that you copy and paste your code into a R script or R markdown document as you go, which will give you a record of what you've done. You'll also need to bring in some answers in order to generate your PC document (below).
The remaining instructions are available here. You'll want to download the following template and open it in RStudio.
Advanced user?
If you are already comfortable with RMarkdown, dplyr, and the rudiments of ggplot, then don't do the assignment. Instead, do the following:
- Install the
babynamespackage. - Pick a movie or TV show that has had very specific names. If you're stuck, you could think about Dallas, 90210, Game of Thrones, basically any popular Disney movie, any movie from the Star Wars franchise, etc.
- Make a plot of the rise (and fall?) of a set of names (as a share of all baby names of that gender) from that show over time. OR, make a different sort of graph (which Disney movie princess has affected a larger share of names?)! Bring in a new theme using the
ggthemespackage if you'd like. - Put your code and output in a .Rmd file and knit to PDF/word/html. Upload that instead.
Submit
Your output should be a Word/PDF/html (pick whichever) that you created by knitting from the template that you edited. Note that if you try to upload a html file on to Blackboard, you will need to compress/zip it first.
PC March 23 - Introduction to {ggplot2}
Assignment
Complete these four primers:
- Derive information with
dplyr: practice w/ pipes and other key commands:summarize(),mutate(), andgroup_by() - (Optional) Exploratory data analysis : this one is fairly short (no coding), but it's a good review about how to think about exploring data, categorical and continuous variables, and what types of visualizations are useful for what types of exploration. It's okay with me if you skip this one if you already feel confident with these concepts.
- Bar charts
- Histograms
The remaining instructions are available here: R_0801_pc_template.html You'll want to download the following template and open it in RStudio: R_0801_pc_template.Rmd
Advanced user?
If you are already comfortable with dplyr, and these ggplot basics, then don't do the assignment. Instead, let's do a quick TidyTuesday assignment!
Because we're going to be tackling inequality (or rather, examining inequality) in a week or two, I'll ask you to make one neat graph based on the 02-09-2021 TidyTuesday - wealth and income!
- Instructions to install and load the package and data. You can either download the entire package, or you can manually pick just one or a handful of files.
- Browse through the data and select one (or more, if you feel like merging) files to work with.
- Create a bar chart or histogram (or a related variant) that is of interest to you!
- Upload a pdf/ zipped html file with your results.
The internet is full of inspiration, as participants post their results and code on Twitter with #tidytuesday. You'll want to go back to posts around February 09-15 ( 👈 👈 embedded in the link). You can start from scratch of build off what other folks have done.
Submit
Finally, knit this document to Word, html, or PDF and upload into Blackboard.
- PDF: If you want to use PDF but are getting an error, install the
tinytexpackage. This is a two-step process. Andrew Heiss provides the clearest explanation. - html: BB will only let you upload a html file if you compress it first! 😢
Note: If you get a weird error message about Error in contrib.url(repos,"source")... comment out the two lines that install your packages.
PC March 30 - ggplot2 - the return!
Assignment
Complete the following tutorials:
- (Optional) Box plots and counts: Coverage of additional graph types that are handy but not critical
- Scatterplots
- Line plots
- Customize plots
Then, download and work through the pre-class template here: R_0901_pc_template.Rmd.
You can find the html version as well: R_0901_pc_template.html.
Advanced user?
If you are already comfortable with ggplot , then don't do the assignment. Instead, let's revisit our TidyTuesday assignment ... for Thursday.
That said, you. may still want a quick refresher with the final ggplot primer: Customize plots - there is good practice with labels, themes, scales (with scale_color_brewer and scale_fill_brewer), and legends.
Dive back into the 02-02-2021 Tidy Tuesday on wealth and income over time.!
- Instructions to install and load the package and data. You can either download the entire package, or you can manually pick just one or a handful of files.
- Browse through the data and select one (or more, if you feel like merging) files to work with.
- Create a scatter plot or line plot (or a related variant) that is of interest to you!
- Make it pretty with lables, themes, colors.
- Upload a pdf/ zipped html file with your results.
The internet is full of inspiration, as participants post their results and code on Twitter with #tidytuesday. You'll want to go back to posts around February 09-15 ( 👈 👈 embedded in the link). You can start from scratch of build off what other folks have done.
Submit
Finally, knit this document to Word, html, or PDF and upload into Blackboard.
- PDF: If you want to use PDF but are getting an error, install the
tinytexpackage. This is a two-step process. Andrew Heiss provides the clearest explanation. - html: BB will only let you upload a html file if you compress it first! 😢
Note: If you get a weird error message about Error in contrib.url(repos,"source")... comment out the two lines that install your packages.
PC April 01 - Definitions of inequality
Read
Chapters 5.9 and 5.10, Economy, Society, and Public Policy
Complete
Visit the Data Access Research Tool from the LIS. Note how you can visualize inequality data based on income or wealth across time for multiple high-income countries!
We're going to replicate a graph and think about the various measures of inequality with the power of R. Download this template and work through it 09-02-preclass.Rmd
You can find the html version here as well: 09-02-preclass.html.
Note that you will need to download a
.xlsxfile from DART. This should be straightforward 🤞. In the event that it isn't, you can download the one I used here as a last resort.Once you've finished, knit and upload to Blackboard.
No advanced user activities this week! But, you can always make your graphs as fancy as you like.
PC April 06 - Trends in inequality
Read
Note: If you have issues w/ article limits and access to The New York Times, please remember that you can sign up for a free digital subscription through UVM! 🎉🎉🎉 Now you can geek out w/ the NYT for free all the time. 🤓
Badger, E. and Quely, K. "Watch four decades of inequality drive American cities apart." The New York Times 02 December 2019 (Updated 11 June 2020).
Lowrey, A. "The wealth gap in America is growing too." The New York Times, 02 April 2014.
Kent, A., Ricketts, L., and Boshara, R. "What wealth inequality in America looks like: facts and figures." 14 August 2019
Optional
Abel, J. and Deitz, R. "Why are some places so much more unequal than others?" Federal Reserve Bank of New York Economic Policy Review, 25.1 Decmeber 2019. <-- This is the full article that informs the NYTimes piece, if you're interested!
Pew Research Center "Many around the world were pessimistic about inequality even before the pandemic." 06 August 2020
The America We Need New York Times interactive feature with heaps of articles on inequality, work, and cities in light of the pandemic. It's kind of amazing.
Saez, E. and Zucman, G. "Wealth Inequality in the United States since 1913" October 2014
Slides from Saez and Zucman that forom the base of the 3rd assigned article.Smialek, J. "Even as Americans grew richer, inequality persisted." The New York Times, 28 September 2020.
Instructions
Complete the following activities. You'll earn 2 points for fully complete with reasonable effort, 1 point for at least half complete, and 0 points for less than half complete.
Your answers should total 300-500 words
Prompts
- According to the Badger/Quealy piece, what factors have driven the divergence in income inequality between U.S. cities? Which strike you as particularly important and/or interesting?
- How has wealth inequality in the United States evolved over the time periods in the articles? How has the experience of different demographic groups varied?
- Returning to the St. Louis Fed reading, what graphic(s) are particulary informative? Which are most aesthetically pleasing? What design choices stand out to you?
PC April 08 - Neighborhoods and income mobility
Read
(6p) Chetty, R., Friedman, J. N., Hendren, N., Jones, M. R., and Porter, S. R. "The Opportunity Atlas: Mapping the Childhood Roots of Social Mobility" (Executive Summary)
Optional
(92p) Chetty, R., Friedman, J. N., Hendren, N., Jones, M. R., and Porter, S. R. "The Opportunity Atlas: Mapping the Childhood Roots of Social Mobility." January 2020.
(105p) Chetty, R., Hendren, N., Kline, P., and Saez, E. 2014 "Where is the land of opportunity? The geography of intergenerational mobility in the United States". massively long, but an important paper!
Instructions
Complete the following activities. You'll earn 2 points for fully complete with reasonable effort, 1 point for at least half complete, and 0 points for less than half complete.
Your answers should total 300-500 words
You'll need to include pictures, so I recommend uploading a document rather than answering in the text box.
Prompts
After reading the executive summary, visit the Opportunity Atlas. First, take a moment to orient yourself. You may want to review the FAQ. Or, you can click on "Explore Stories"--> "Tutorial" for a walkthrough of functionality. The right panel lets you focus on outcomes for a particular subgroup by parental income, race/ethnicity, and/or gender. Some subgroups won't be possible if there is insufficient sample size, particularly for low-population areas. find a town/area that is important or interesting to you. It could be where you grew up, where you've lived for a while, a place you're generally interested in learning more about.
- What are the "outcome variables" that it plots? What exactly does "household income" mean as an outcome variable?
- What geographic area did you choose, and why?
- Play around with outcomes and the subgroup restrictions. You can also explore neighborhood characteristics and see whether you can observe any (rough) correlations.
- Select two maps that are strike you as particularly interesting and paste them (you can take a screenshot or click on "Download as Image"). For each one, write a few sentences about what we should take away from it. Does what you find align or contrast with any of the takeaways in the Chetty summary you read?
PC April 13 - Impact of Policy on Inequality
Read
(2p) Chetty, R., Hendren, N., and Katz, L. "The Effects of Exposure to Better Neighborhoods on Children" (Executive Summary). May 2015
(~10p) Collinson, R. and Ludwig, J. "Neighborhoods and Opportunity in America." The Brookings Institution. 19 September 2019.
Optional
(90p) Chetty, Raj, Nathaniel Hendren, and Lawrence F. Katz. "The effects of exposure to better neighborhoods on children: New evidence from the Moving to Opportunity experiment." American Economic Review 106.4 (2016): 855-902.
(12p) Ludwig, Jens, Greg J. Duncan, Lisa A. Gennetian, Lawrence F. Katz, Ronald C. Kessler, Jeffrey R. Kling, and Lisa Sanbonmatsu. 2013. “Long-Term Neighborhood Effects on Low-Income Families: Evidence from Moving to Opportunity.” American Economic Review 103, no. 3: 226–231.
Instructions
Complete the following activities. You'll earn 2 points for fully complete with reasonable effort, 1 point for at least half complete, and 0 points for less than half complete.
Your answers should total 300-500 words
Prompts
- What is the Moving to Opportunty demonstration? That is, what was the "treatment"?
- One challenge with measing the causal impact of neighborhood is that there are all sorts of factors correlated with one's decision to move in or out of a place. For example, parents that accept a longer work commute move to neighborhoods with higher-performing schools may be parents that particularly value education and invest in their chidlren in other ways. How do Chetty et al. ensure they avoid this concern?
- What questions were Chetty et. al using the MTO demonstration to answer?
- What do they find, and how does it contrast with previous studies?
- What do you think policymakers should take away from this study. Put differently, based on these results what policies strike you as most likely to help kids growing up in "low-opportunity" neighborhoods? Should MTO be scaled up and/or does it suggest other policy options?
[Unit 3] Pre-Class Activities
PC April 27 - Returns to Education
Read
(p10) Webber, Douglas. “Is the Return to Education the Same for Everybody?” IZA World of Labor, October 1, 2014. Read the "full article" version!
Instructions
Complete the following activities. You'll earn 2 points for fully complete with reasonable effort, 1 point for at least half complete, and 0 points for less than half complete.
Answer some or all of the prompts below, but your answers should total 300-500 words
Prompts
Consider the following statement: 10 year after graduating college, the median-earning economics major earns 50% more than the median earning biology major ($83k vs $56k), and 150% more than a high school graduate ($83k vs $33k). (Data taken from here).
a. Based on the readings, why would it be inaccurate to tell a room full of biology majors that if they all switched to economics, they would (more or less on average) increase their earnings 10 years out by 50%? What other factors might be important?
b. What additional factors beyond what you already listed might be important for why it would also be inaccurate to tell a room full of high school seniors that if they all become economics majors, they would (more or less on average) increase their earnings 10 years out by 150%?
- What individual-level factors influence a person's return to education? Are there factors that were not discussed in the article?
- What characteristics of a student's institution might affect their returns to education?
- There have been a lot recent news and debate about whether going to college is "worth it." Where do the authors of this policy brief fall on this debate, and under what circumstances would it not be worth it? Are there other factors they may not be considering?